
FEBRUARY 2024 | PROPERTY MARKET REVIEW
In our market review for February 2024, we look back on noteworthy surveys and reports, significant policy decisions and other developments affecting the UK residential property sector.
The latest house price indices show a generally improving trend, with more sources reporting month-on-month growth. We are also continuing to see clear regional variations, with prices remaining most resilient in the UK’s more affordable regions.
Geographic differences are less obvious with respect to rental growth, but they are very apparent when it comes to yields. Rents in all regions of the UK are rising far faster than the rate of inflation, but yields are certainly better in markets where asking prices tend to be lower. But even in the poorest-performing regions, yields are still comparatively strong and delivering inflation-beating returns.
Darren Bennett
Managing Director
—————————
HOUSE PRICE INDICES
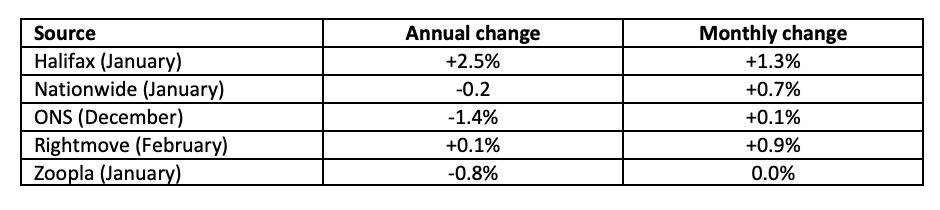
The following organisations produced house price indices in recent weeks. (Percentages refer to capital growth rates.)
All sources show improving monthly results. The annual change figures are also improving and even those that are still negative show an improvement on the previous month’s figures. The Home Asking Price Index, for example, reports a return to month-on-month growth (+ 0.2%, as against zero last month) and an improvement in annual figures, from - 0.5% in January to - 0.1% in February.
Commenting on the improving monthly figures, Iain McKenzie, CEO of The Guild of Property Professionals said “UK house prices seem poised for a strong 2024, with January’s data signalling further market recovery… (Buyers) are returning to the market faster than expected.”
Nathan Emerson, CEO of Propertymark, said “2024 seems to be starting off more positive for the housing market... Hopefully, this is the start of a period of economic recovery for the nation.”
Rightmove’s February House Price Index reports that not only are values moving “tentatively” in the right direction; sales activity is also growing. It states that the number of sales agreed in the first six weeks of the year is + 16% higher than at the same time in 2023.
NATIONAL AND REGIONAL PATTERNS
According to ONS data, covering the 12 months to December 2024, the state-level pattern of annual price growth was as follows:
Scotland + 3.3% / £190,000 (£194,000 in November)
England - 2.1% / £302,000 (£301,613 in November)
Wales - 2.5% / £214,000 (£212,866 in November)
Northern Ireland + 1.4% / £178,000 (Q4 2023 figures)
ONS lists growth rates in the English regions as follows:
North West + 1.2% (up from - 2.0%)
West Midlands + 0.3% (up from - 3.4%)
North East - 0.8% (down from - 0.4%)
East Midlands - 1.0% (up from - 3.0%)
Yorkshire & Humber - 1.2% (down from - 0.8%)
South West - 2.2% (up from - 4.1%)
East of England - 3.8% (down from - 3.3%)
South East - 4.6% (down from - 2.3%)
London - 4.8% (up from - 6.0%)
Note that these ONS figures lag behind other indices by at least a month and they will therefore be slower to register any upturn in values.
In its February index, Home observes: “At the regional level, typical time-on-market figures indicate that the North of England, Scotland and Wales all continue to thrive, with activity over and above the pre-COVID years. Moreover, this enhanced momentum correlates closely with positive annualised price growth in those regions.” It notes that all but three regions saw a return to monthly growth.
HOUSE PRICE FORECAST
At the end of 2023, the majority of sources were predicting modest falls in average asking prices over the course of this year. However, against an improving backdrop, some are now revising their estimates upward. There is certainly no clear consensus but, with the last two months producing better-than-forecast growth, we might expect other sources to do the same over the coming weeks.
RENTAL DATA
Shown below are the average rates of annual rental growth according to the UK’s best-known rental indices.
Goodlord Rental Index + 7.2%
Homelet, January Rental Index + 7.5%
Home, February Asking Price Index + 3.8%
Rightmove, Q4 Rental Price Tracker + 9.2%
Zoopla, December Rental Market Report + 9.7%
RENTAL SUPPLY & DEMAND
At the end January, Propertymark published its Housing Insight Report for December. It stated that the number of new prospective tenants registered per member branch had fallen from 86 to 63. However, the availability of homes also fell over the same period, to just 9 per member branch. Thus, tenants still greatly outnumber lettable properties, currently by a ratio of 7:1.
Research by the mortgage lender Paragon Bank produced similar findings. In a press release, Paragon stated that 63% of the landlords in its survey reported growing tenant demand in the final quarter of last year, with 37% of those reporting that demand had grown “significantly.” It added that the North West, Yorkshire and East Midlands recorded the highest demand levels, and that there was a “strong correlation with rent increases across these regions.” The company’s director of mortgages, Richard Rowntree, said: “Although tenant demand has come off its record highs, there remains a chronic supply demand imbalance across large parts of the country.”
A new survey by the National Residential Landlords Association also highlighted strong demand. In a press release dated 9 February, NRLA wrote: “Two thirds of landlords say the demand for private rented housing is continuing to increase… The country needs more of every type of housing, and that has to include new homes for private rent.”
REGIONAL VARIATIONS IN RENTS
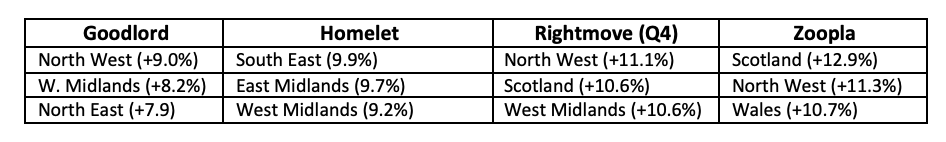
Different sources show different regional variations in annual rental growth. The following table lists the three best-performing regions by source. Figures in brackets refer to year-on-year growth rates.
On a monthly basis, Goodlord reports that the biggest change in rents was recorded in Greater London. The region saw a + 1.8% increase in rents during January, bringing the average to £1,968. UK-wide the average month-on-month increase was + 0.6%. Goodlord reports that average void periods have fallen slightly since January 2023, from 23 to 22 days.
Home reports substantial regional variations in rental returns, ranging from + 14.1% in the North East, to - 3.4% in Greater London.
RENTAL YIELDS
No significant new yield data emerged this month. Last month, Fleet Mortgages listed the top-performing regions as Wales (8.9%) the North West (8.6%) and Yorkshire & Humber (8.4%). Rightmove’s top three included the North East (8.7%), Scotland (8.1%) and Wales (7.7%). Both reported that London had produced the lowest yields.
PRIME CENTRAL LONDON
Rightmove’s February House Price Index continues to show a marked North/South divide, with properties in northern markets appreciating considerably faster than those further south. The East Midlands, the East of England, the South West and South East all saw average values continue to fall, but London bucked the trend, producing year-on-year growth of + 0.2%.
Rightmove’s index also includes its usual feature on London boroughs. It notes that, on an annual basis, prices grew most strongly in Westminster (+ 9.9%), followed by Richmond upon Thames (+ 5.1%), Wandsworth (+ 3.7%), Hammersmith & Fulham (+ 3.4%), and Lambeth (also + 3.4%). The poorest performer was Camden, where values fell by - 7.8% annually.
On a monthly basis, and for the first time in many months, a clear majority of London boroughs saw average values rise; most notably in Westminster, where they increased by + 4.6%.
Homelet’s January Rental Index also includes a ‘London Focus’ section. It reports that average rents fell by - 2.2% in London during the course of January, reducing the year-on-year growth figure to + 4.6%. However, some individual boroughs fared better. Barking, Dagenham and Havering saw the strongest growth in rents (+ 12.8% year-on-year), followed by Lambeth (+ 11.4%), and then Lewisham and Southwark (+ 9.4%). Over a five-year run, Homelet finds that Westminster has produced cumulative rental growth of + 52.1%.
We’ll publish a more detailed analysis of the Prime Central London market in our Q1 Quarterly Market Report but below is a summary of key statistics published by LonRes.com.
PCL rental index (year-on-year change) - 0.1%
PCL rental index (quarterly change) + 4.6%
Index for Prime London Fringe (y-o-y) + 4.4%
Yields (average for PCL) 3.7%
Yields (Prime London Fringe) 4.9%
Strongest PCL yields (Chelsea) 3.9%
INFLATION & THE BASE RATE
At the start of February, the Bank of England’s Monetary Policy Committee announced that it was holding the official base rate unchanged at 5.25%. Two of its nine members voted for a + 0.25% increase, while one voted for a small reduction but, overall, the vote was for no change. The Bank’s governor, Andrew Bailey, said "we need to see more evidence that inflation is set to fall all the way to the 2% target, and stay there, before we can lower interest rates."
The Bank notes that although CPI inflation is projected to fall temporarily to the 2% target in Q2 2024, it could increase again in Q3 and Q4 as a result of energy price fluctuations and what it terms “geopolitical factors.” It adds that “CPI inflation is projected to be 2.3% in two years’ time and 1.9% in three years.” These are significantly better figures than those in its forecasts last year, and they raise hopes for rate-cuts later this year.
However, an ONS report on 14 February showed that CPI inflation had stayed unchanged at 4.0%. Food costs had come down but the savings were offset by the rising cost of other commodities including energy. Some members of the MPC will doubtless conclude that, as a result, the Bank should keep the base rate unchanged for the time being. However, another February report showed that the UK economy entered a technical recession in the final quarter of 2023. That’s a finding that supports an opposing argument, because higher interest rates act to suppress economic growth.
As ever, the Bank will have to find a balance. However it seems very probable that the new data will only affect its decision about when to cut the official Bank rate; not whether that rate should be raised or lowered. It’s that belief that supports the general sense of optimism that is returning to the sector.
SUMMARY
The stubbornness of inflation took some markets by surprise, and the consequent effect on swap rates may cause the base rate of lending to stay higher than some lenders had forecast. As a result mortgage rates may take longer to decline, but the prospect of an eventual fall is almost beyond doubt. Given the likelihood of falling inflation and lower mortgage rates, coupled with strong wage growth and high levels of employment, few would doubt that the outlook for the property market is looking increasingly positive.
Market sentiment is improving, and market activity continues to ramp up.
The longer-term expectation for CPI inflation is that it will fall towards 2% this year.
As inflation falls, so too should interest rates on fixed-rate mortgages.
In the meantime, employment and average earnings remain robust, underpinning people’s ability to pay rents and mortgages.
ONS reports that average earnings are rising by + 6.2% year-on-year.
All UK regions continue to produce real-terms rental growth.
Most price indices show that the UK’s more northerly regions are still delivering respectable capital growth.
In the UK’s more affordable markets, yields are significantly exceeding CPI inflation.
If you have any questions about any aspect of property investment, please call us today.